UV index and UV dose: cloud modification
|
|
| Main data product description page |
Cloud-modified UV dose data
In order to determine the actual total daily UV dose the attenuation of the UV light due to clouds needs to be accounted for. This is done by multiplying the clear-sky UV dose rateUVR(t)by the cloud modification factorf(C)at timet.The factor
f(C)is determined from cloud observations by the Meteosat Second Generation (MSG) satellites, operated by EUMETSAT. The way we determinef(C)is described below.In case of no attenuation, i.e. clear-sky situations,
f(C) = 1. Due to scattering, it is possible thatf(C) > 1. For some cloudy situations,f(C)may be as small as0.2. Since the cloud modification is a simple multiplicative factor, the error on the UV dose related to an error inf(C)is simply the error on the latter, which turns out to be a constant:σ(C) = Δf(C) = 0.077. Note that for clear-sky UV dataσ(C) = 0.Cloud modification factor
For determining the cloud modification factorf(C)f(C)we use cloud information from the series of MSG satellites (MSG-1, 2 or 3, i.e. Meteosat 8, 9 and 10), which is available since the end of Jan. 2004. The MSG cloud data is given once per 15 minutes, though on some days some of these quarters of an hour are missing (as discussed later on). For the TEMIS UV processing we use MSG Cloud Physical Properties (CPP) data, available in the form of daily netCDF files. Since we integrate the daily UV dose between "ScatterRise" and "ScatterSet", cloud data of more than 24 hours is needed. For this reason a pre-processing step gathers the cloud data needed for a given UV date into a special file, used by the TEMIS UV program.The TEMIS UV data versions v2.0-v2.1 uses MSG CCP data version 0001, while MSG CCP data version 0002 is used as of UV data versions v2.2.
- The following subjects are discussed below:
- Computation of
f(C)- Mapping the MSG lat/lon grid & field-of-view onto the UV grid
- Time range of cloud data needed
- Setting up the MSG data in a pre-processing step
- Extrapolation to ScatterRise & ScatterSet
- Minimum number of available cloud data
- Dealing with missing MSG CCP cloud data
- Impact of change from MSG CPP data version 0001 to version 0002
Computation of
The cloud modification factorf(C)f(C)as of version 2.0 of the TEMIS UV processing is determined from the ratio between the broad-band "Surface downwelling shortwave flux" (SDS) and theSDSassuming clear-sky (SDScs):[1] f(C)* = SDS / SDScsFollowing the work of Evert Wiegant [Wiegant, 2016], a correction is applied tof(C)*based on a fit against theSDS1+2andSDS1+2,csfor UV bands 1+2 (which are available for the month of Aug. 2014 for internal KNMI testing purposes):[2] f(C) = -0.43511656 × (f(C)*)^2 + 1.34801261 × (f(C)*) + 0.09549913The value off(C)is computed for each MSG data point and then averaged over each UV grid cell to find thef(C)for the cloud modified UV dose calculationWe require that there are at least two MSG data points in a given UV grid cell. For UV grid cells with zero or one MSG data point we cannot determine a cloud modification factor and the cloud-modified UV dose for those grid cells is therefore undetermined ("no data" value = -1).
Note that the
SDSof an MSG CPP data point may be zero. This sounds strange, as it would mean that no light at all passes through the clouds. The reason this happens is that theSDSalgorithm contains a correction term for ice clouds, reducingSDS. In some cases this leads to negativeSDSvalues, in which case theSDSis set equal to zero, thus also givingf(C)* = 0. We take these MSG measurement into account in the averaging per the UV grid cell as these constitute regular measurements, not retrieval errors.Mapping the MSG lat/lon grid & field-of-view onto the UV grid
The projection of the MSG lat/lon grid onto the UV grid is done as follows. For each MSG pixel with a valid lat/lon coordinate it is checked that:Note that the MSG grid is along curved lines in the lon/lat plane and that the spacing in that plane is irregular, both due to the curvature of the Earth's surface.
- the four MSG pixels left, right, above and below are valid, and that
- the distance between these four and the MSG pixel in question is less then the UV grid cell size of 0.25 degrees.
The actual MSG field-of-view (FOV) of the observations is smaller than the lat/lon grid area given in the MSG data files: the
SDSdata we need is available only within the area for which θsat < θmax, where θsat is the satellite zenith angle, the angle between the zenith of (lat,lon)=(0,0) and the line from that point to the satellite. For MSG CPP data version 0001 θmax = 78°, for version 0002 θmax = 84°.Within the MSG FOV the
SDSdata we need is only available for situations where the solar zenith angle θsun of the MSG data is θsun < θmax. This area moves north-south with the seasons and east-west with the time-of-day. Around the equinox days at 12h UTC it covers (almost) the full MSG lat/lon grid area (i.e. the light gray area in the following figure).
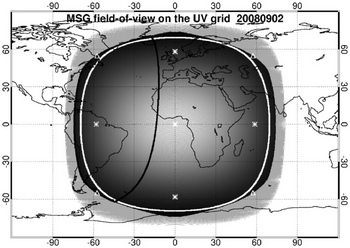
MSG lat/lon grid (gray area), field-of-view area with θsat < 78° (white line) and eastern edge of the area with θsun < 78° at 18h UTC (black line), on the UV grid for two days with observations by two different MSG satellites. The white triangles mark points used further on in the text (the asterisks points are from another application of the figures). The above figure shows the location of the MSG lat/on grid and the field-of-view (FOV) for two different dates with observations by two different MSG satellites. The outer light gray area marks the full MSG lat/lon grid area. The area inside that ranging from black (1 MSG data point) on the outside to white (100 MSG data points) in the centre is the area of MSG data that satisfies the UV selection criteria mentioned above. The thick white line indicates the MSG's actual FOV.
Time range of cloud data needed
In order to have an idea of the time range needed between ScatterRise and ScatterSet, consider the extrema of these two along the edge of the part of the MSG lat/lon grid that satisfies the mapping criteria, i.e. along the outer black edge in the above figure. Given that the 'equation of time' (mentioned here) depends on the day of the year, the extrema will differ by some minutes, but that is not relevant at this point.It is expected that the earliest moment of ScatterRise occurs at the Northern (Southern) hemisphere around 21 June (December), and the latest moment of ScatterSet on the opposite days. A test of all grid cell centre coordinates along the perimeter of the MSG lat/lon grid -- the area inside the black perimeter in the above figure -- for the year 1995 shows:
  [3a]    min(T_ScatterRise) = -3.80469 UTC ~ 20:11:43 yesterday
  [3b]    max(T_ScatterSet ) = 27.84896 UTC ~ 03:50:56 tomorrow
This minimum and maximum occurs at grid cell centres lon = ±57.375° and lat = ±54.875°; see the white triangles in the figure. TheT_ScatterSetcorresponding to [3a] is close to 24 hours after the minimum, and theT_ScatterRisecorresponding to [3b] is close to 24 hours before the maximum.Since the MSG FOV varies in longitude only within the fixed lat/lon grid, the
min(T_SscatterRise)andmax(T_ScatterSet)times mentioned in [3a-3b] are valid for all MSG observations, with a little variation related to the day-to-day and year-to-year variation in the Earth's orbit. For the cloud modification information of today we would therefore need cloud information between 20h UTC yesterday and 04h UTC tomorrow.Setting up the MSG data in a pre-processing step
In the TEMIS UV processing a pre-processing step is used sets up cloud data arrays spanning the time from 20:00 UTC yesterday to 04:00 UTC tomorrow, in order to provide the cloud modification factors necessary for the UV dose products.The MSG data is provided once every 15 min, where one scan over the full field-of-view takes 15 min, so that in fact each MSG data point has its own time stamp. To keep matters simple, all measurements of a 15 min scan are attributes to the moment of the first point, indicated by the step in the "time" dimension in the MSG CPP files, and we use this data for the three 5-min time steps in the UV dose integration.
The
SDSdata we need is provided within the θsat < θmax area only for observations that have the solar zenith angle θsun <θmax, and the time period for which this is the case lies well within today's data range, so that we only need today's MSG file. From this, we then need to extrapolate theSDSdata to the actual ScatterRise and ScatterSet moments -- see below.Extrapolation to ScatterRise & ScatterSet
As mentioned, in the TEMIS UV processing, the individual MSG valuesf(C)*as given by [1]) are mapped onto the UV grid, averaged over the number of data points, and that average is then converted tof(C)using [2].We need cloud data between rise and set of the scattered light, whereas we have it only for θsun < θmax, so we need to perform some form of extrapolation. Best would probably be to extrapolate from the UV dose rate values closest to θsun = θmax to zero at ScatterRise and Scatterset, but that would be a bit cumbersome to program. If the UV dose rate of only the first and last point is used and the extrapolation to zero is linear, this effectively means that
f(C)is kept constant.Since the very first and last
f(C)data point is determined at high θsun, the data will have a relatively large uncertainty, hence it is not a good idea to just use the first and last data point for the extrapolation. Instead we take the average over the first and last three quarters of an hour -- named below "quaters" for short -- off(C)values. Since the actual cloud cover may be very different, we are making a mistake here, but we have to assume something for the cloud modification factor.

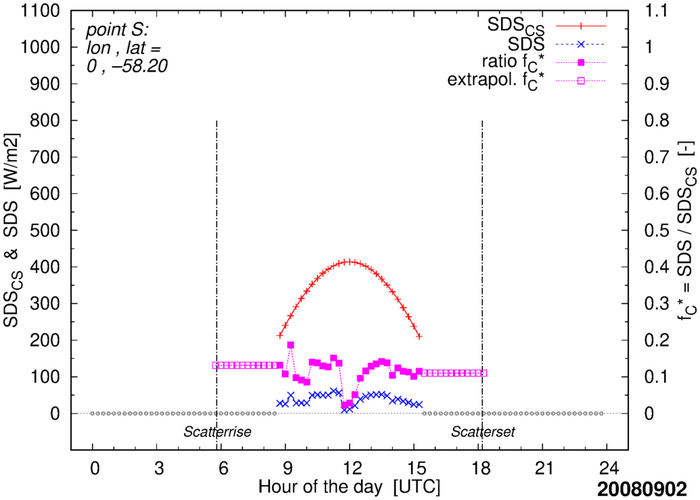
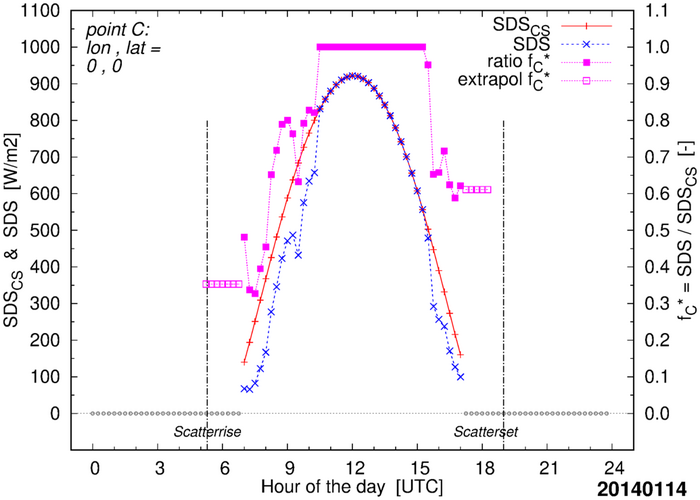
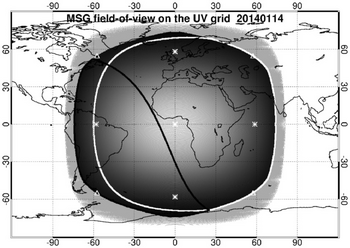
Examples of the extrapolation of f(C)*data (right axis) determined from theSDSdata (left axis) for two MSG data pixels with θmax = 78°. The points are selected to clearly show the extrapolation approach; in practice the extrapolation is performed per UV grid cell on the finalf(C)value.The extrapolation is performd on the
f(C)of [2], i.e. after averaging the individual MSG data. As illustration the above figure shows how the extrapolation works out in case it would be performed on individual MSG data points, i.e. on the ratiof(C)*of [1]: the filled squares are the measuredf(C)*ratios, the open squares are the extrapolatedf(C)*ratios. The following figure shows a real-data example.
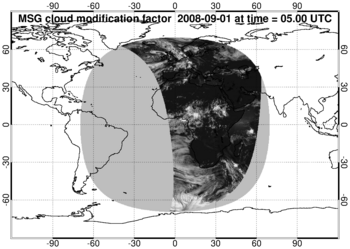
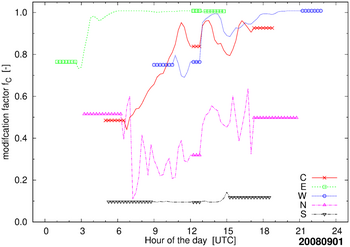
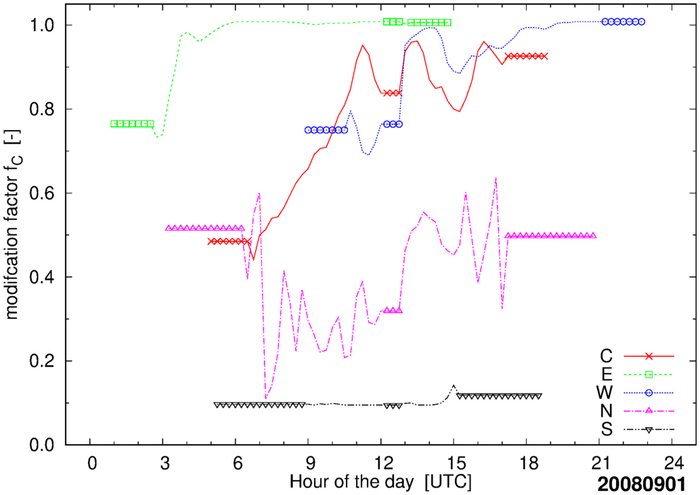
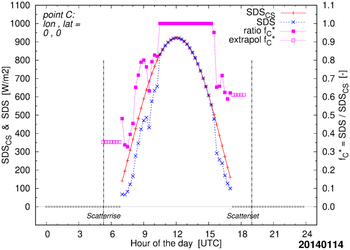
Example of final f(C)values for a day with 3 missing quarters at 12:15, 12:30 and 12:45 UTC.
Left:f(C)at 05:00 UTC, where white (black) represents large (small) attenuation, i.e. low (high)f(C)-- fully white (black) is forf(C)=0(f(C)=1.1). The light-gray area is the area of MSG observations, i.e. θsat < 78° (cf. white line in left panel of first figure on this page); at the south-eastern edge of this area data is missing because the 3 missing quarters are at the local end of the period with θsun < 78°.
Right:f(C)time series for five points, namely C at lon,lat=(0,0), E (+90,0), W (-90,0), N (0,+90) and S (0,-90). Symbols along these lines indicate the points originating from the extrapolation to ScatterRise and ScatterSet and from the filling-in of the 3 missing quarters.Minimum number of available cloud data
At the northern & southern most MSG data pixels there is scattered light throughout a large part of the day, above the Arctic Circles (at about ±67°) even up to the full 24 hours of the day if it's summer there. In winter time, however, the Sun remains outside the Arctic Circles and just outside these circles daylight may be only seen during a short time around solar noon.We have to set a limit to the minimum number of quarters around solar noon for which we have
SDSdata in order to compute the UV dose: with too littleSDSdata available we need to set the UV dose grid cell to "no data".Since we decided (a) to use 3 data points at begin and end of the day for the extrapolation and (b) that a data gap of missing cloud data -- see below -- may not be longer then 3 quarters, we need at least 3 quarters of valid
SDS.Dealing with missing MSG CCP cloud data
The SDS data is expected to be available for all MSG CPP points that have θsat < θmax° and θsun < θmax;. There are some occasions under which one or more MSG CPP points that fulfill this criterion appear to have no valid SDS data.An individual MSG CPP point that is expected to have valid data may be missing, e.g. because one of the input parameters of the CPP algorithm is missing. These individual missing points are ignored by the cloud preprocessor: they are skipped in the averaging of the MSG points per UV grid cell.
Occasionally, one or more of the quarters may be missing from an MSG CPP file entirely. If the gap is not too big, we can fill it on the basis of persistence: assume that the cloud condition does not change, i.e. continue with the last know; see the example in the right panel of the last figure above. This is a fair assumption over a short period -- we decided to set this at 3 missing quarters. If more quarters are missing, the full day is discarded and no cloud modified UV dose is calculated for that day (an overview of the missing days is given here).
Since we decided to use 3 quarters for the extrapolation to ScatterRise and ScatterSet (see above), the data gap at begin or end of the period with θsun < θmax cannot be larger than 2 quarters. This is the reason that in the left panel of the last figure above the south-eastern "corner" of the MSG field shows no data. In case the data gap at begin or end is 2 (1) quarters, the extrapolation is based on one (two) data points, rather than three.
In case the 3 sequential quarters are missing from the period of extrapolation beyond θsun = θmax; for certain UV grid cells, the cloud data for these grid cells is discarded and the daily cloud modified UV dose cannot be computed for these grid cells. For the other grid cells the 3 sequential quarters then fall either somewhere during the day of well beyond the θsun = θmax time and there is no problem computing their daily cloud modified UV dose. The result is a map with a small area of missing cloud modified UV dose data, as can be seen in this example.
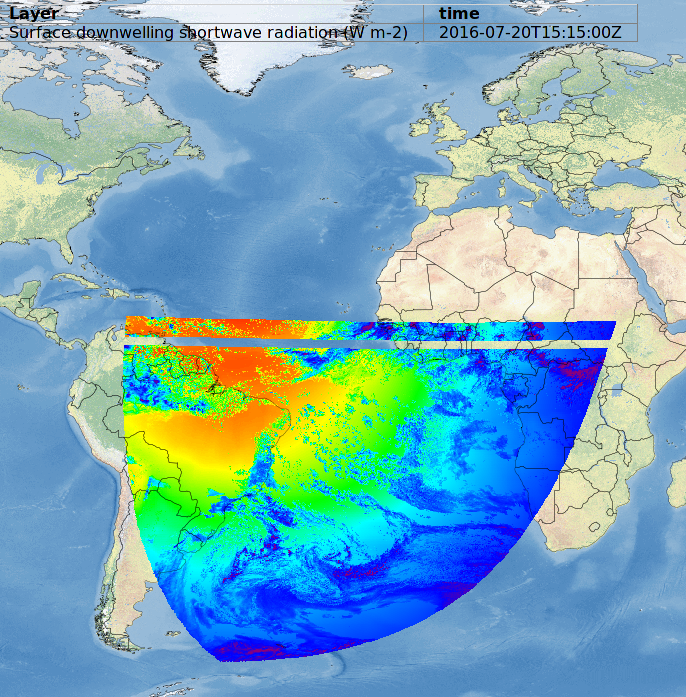
The MSG data is transferred in latitudinal segments and it turns out that for a given quarter one or more of these segments has no valid data -- the figure below gives an example. Fortunately this happens rarely, but we must check for it. We decided to check for this problem by comparing the actual number of valid MSG data points against the number of expected valid MSG data points along a single latitude index row in the MSG data: if more than half the data is missing, we assume that we have a case like the one shown in the figure below and we mark this quarter as unavailable and treat it as mentioned above using persistence.

Example of a case where part of an MSG disk is missing from the quarter with start time 15:15 UTC on 20 July 2016. The map is a screenshot from the MSG Cloud Physical Properties (CPP) website. Impact of change from MSG CPP data version 0001 to version 0002
The MSG CPP data versions 0001 and 0002 differ in the extend of the actual filed-of-view (FOV) of the observations: version 0001 data has θmax = 78° while version 0002 has θmax = 84°.This increase in the solar and satellite zenith angles has two effects:
The latter point cannot be seen clearly in the data, due the small impact mentioned. The first point shows up clearly in maps of the cloud-modified UV dose, as can be seen in the following figures. For the TEMIS UV data service for the Dutch Caribbean region this increase of the FOV is of particular interest, as the example figures show.
- Cloud data is available over a larger geophysical area
As a result of this the UV dose data extents further North/South and further East/West: along the equator and along the zero meridian the from about ±69° to about ±74° for the MSG satellite positioned above (longtide,latitude) = (0,0), which is usually the case.
- Cloud data is available over a longer period of time during the day
As a result of this we need extrapolate over a shorter range of time to ScatterRise and ScatterSet, making the daily UV dose values more reliable, although the impact of this will be small as for these periods the Sun is low above the horizon and thus there is little UV light to begin with.


Daily cloud-modified Vitamin-D UV dose for 7 March 2021 for cloud data limit to θmax = 78° (left) and to θmax = 84° (right) for the whole world (top) and the Dutch Caribbean region (bottom). The MSG CPP data versions 0001 and 0002 furthermore differ slightly in the value of both the
SDSand theSDScsthat make up the cloud modification factor, since there are some changes in the algorithm. This turns out to have some effect on the values of the cloud-modified UV dose, as the following scatter plot shows, ranging from a few percent for the highest UV dose values to 10% for medium values to
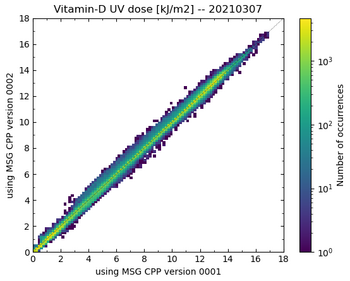
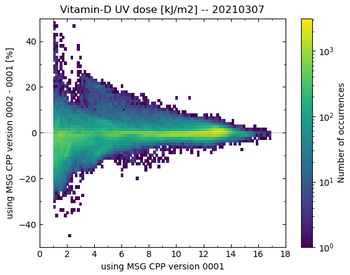
Scatter plots of the cloud-modified vitamin-D UV dose for 7 March 2021 using MSG CPP data of version 0001 along the horizontal axis and along the vrtical axis version 0002 (left) and the relative difference between both versions (right), for the common area of θmax = 78°. In the plot on the right the low UV dose values are omitted because the relative differences may be very large there, but given the low values that is not so important. The changes in the MSG CPP thus clearly affect the TEMIS UV data product, hence the change of the TEMIS UV data version number from 2.1 to 2.2 with the switch of the MSG CPP data.
References:
- Wiegant, E.: 2016,
- Improving satellite-based estimations of UV index and dose and first assessment of UV in a world-avoided
- Master Thesis University of Utrecht & KNMI Scientific Report WR2016-01, 2016.
- [ PDF file ]
- Zempila, M.M., Van Geffen, J.H.G.M., Taylor, M., Fountoulakis, I., Koukouli, M.E., Van Weele, M., Van der A, R.J., Bais, A., Meleti, C. and Balis, D.: 2017,
- TEMIS UV product validation using NILU-UV ground-based measurements in Thessaloniki, Greece
- Atmos. Chem. Phys. 17, 7157-7174.
- doi:10.5194/acp-17-7157-2017
- MSG-CPP product description
![]() last modified: 23 March 2021
last modified: 23 March 2021
data product contact:
Jos van Geffen & Michiel van Weele &
Ronald van der A
Copyright © KNMI / TEMIS