UV index and UV dose: surface elevation correction
data version 2.x

UV index and UV dose: surface elevation correction
|

|
| Main data product description page |
Surface elevation correction
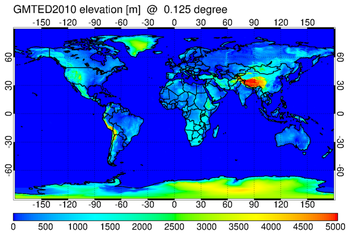
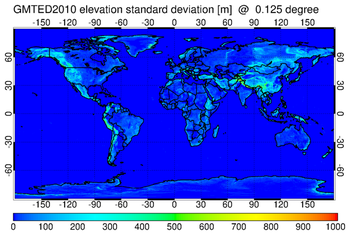
The amount of UV radiation received by someone at the Earth's surface is affected by the local surface elevation: the higher the surface, the more UV radiation. For this reason the UV index and UV dose calculation applies a 5% increase of the incident UV irradiance per km surface elevation above sea level:[1] f(H) = 1 + 0.05·Hwhere the surface elevationH(in km w.r.t. sealevel) is determined from the GMTED2010 global digital elevation model (DEM), which is averaged to the UV grid resolution of 0.25°×0.25°.The averaging of the GMTED2010 data over the UV grid cell provides also a standard deviation, which is propagated to the UV index and UV dose error estimates.
If you would like to adjust the elevation correction from the grid cell average evelation
H_gridto a specific elevationH_new, the above equation shows how, sincef(H)is a multiplication factor in the UV index or UV dose calculation:[2] UV_new = UV_grid * f(H_new) / f(H_grid)withUV_gridthe UV index or UV dose value from a gridded TEMIS UV data file.


GMTED2010 based surface elevation data (left) and standard deviation (right) at the UV grid resolution of 0.25°×0.25°.
Note on the percentage increase per km
The TEMIS UV dose service provides the UV dose for three action spectra. The increase of the UV radiation with 5% per km elevation mentioned above is an estimate made for the erythemal UV radiation, i.e. for the UV radiation covering both the UV-A and UV-B wavelenghts, based on the regular (Raleigh) optical effects in the atmosphere for those wavelengths.The other two action spectra, vitamin-D and DNA-damage, stress the shorter UV-B wavelengths much more, and for those data products the percentage increase might well be 10% or more. On the other hand the Raleigh scattering is less for shorter wavelengths.
In addition, in the presence of clouds, the scattering by clouds dominates of the UV radiation is dominant and is the height dependence of the UV under the clouds small.
For practical reasons we have chosen to use one percentage for all TEMIS UV data products.
GMTED2010 vs. Copernicus 90m DEM
The GMTED2010 elevation database is known to suffer from some problems, notably over Greenland, Antarctica and the Caspian Sea. New elevation databases were published by the Copernicus programme around 2020, which solve those issues and are based on newer measurement and are provided at different resolutions. For the S5P/TROPOMI project, the GMTED2010 based elevation dataset was replaced by a Copernicus 90 metre based elevation dataset.To investigate what this update would mean for the UV data, the Copernicus 90 metre DEM was gridded to the UV resolution of 0.25°×0.25°. For by far most of the surface, the impact in the UV data -- computed following eq. [2] above -- is less than 1%. Only for areas along the coast of Greenland and over small parts of Antarctica (and one or two grid cells over the Himalayas) differences are somewhat bigger, but still less than about 5%. Since there areas have in general low UV radiation, the actual impact is negligible. Hence, there is no need to update the DEM in the current UV data processing.
References:
- For some more info on the GMTED2010 elevation data, its source and description, and for download of the data averaged to different resolutions, see this page.
- For info on the Copernicus elevation data, see https://doi.org/10.5270/ESA-c5d3d65
![]() last modified: 11 December 2024
last modified: 11 December 2024
data product contact:
Jos van Geffen & Michiel van Weele &
Ronald van der A
Copyright © KNMI / TEMIS